This guide will walk you through how to find and interpret your students report data and how to print and or export that data for your records.
TABLE OF CONTENTS
- Navigating the Reports Tab
- Interpreting the Data
- Data Overview
- Additional Report Views
- Printing an Individual Student Report
- How to Export Reports
Navigating the Reports Tab

The drop-down menus replace the old report picker. From the drop-down menus you can choose the time frame and which class the reports reflect.
Once a class and time frame is chosen you will be able to choose which assignments you would like to see, you can choose as many decks as you need. All of your folders from your Library are reflected here to allow for easier navigating your students assignments. Or you can search for a deck using the search bar!

You can navigate multiple deck reports using the scroll bar at the bottom of the list of students.
Time Frame
Within the Timeframe dropdown, you will see some options as well as a number displayed next to each. This number represents the number of plays for each timeframe. This allows you to see performance on the same material over time.
Click to select the timeframe for the report.

Classrooms
The classrooms dropdown will show your classes. Choose one to view the report for that class.

Decks
All of your currently assigned decks for the class chosen are located in the Currently Assigned folder.
All of your folders from your Library are reflected here to allow for easier navigating your decks. Or you can search for a deck using the search bar! You can select one or multiple decks to see in this page.
Report
Once you have selected your criteria, the main reports area will populate.
(Click Picture to Zoom)

Filters and View Options
You have some options and filters here too. You can search for a specific student, sort the list by first or last name, as well as export or print the report.

Go Live: Real-Time Monitoring
For Premium Memberships or higher, you also have the ability to Go Live to watch student progress in real-time. Go Live is handy for remote and in-person instruction because it allows you to spot evolving trends and do in-the-moment re-teaching. Simply select the class and decks you want to monitor and click the Go Live button to enable.
Interpreting the Data
Let's take a look at some data, and what all the numbers and symbols mean.
First some vocabulary:
- A batch is a subset of cards delivered. The default batch is 20. Some decks will have more or less, and some require all cards to be completed.
- A set is the delivery of all the cards in a deck.
Please note: After playing one batch or one set of cards, Last, Best and Average will all be identical.
(Click Picture to Zoom)

When a student plays additional batches, new cards from the set are delivered. If there are not enough new cards remaining in the set to form a full batch, some older cards are delivered again.
Data Overview
We will cover each part of the data individually, but let's take a look at 1 report for a single student.
In the below example the student Played all the cards in this deck twice, completing a total of 20 cards, the Gem metric shows that they have answered 10 out of 10 possible answers correctly at least once, and it took them 1 minute and 54 seconds of total Time for these two plays. The student has an Average correct percentage of 90% or 18/20 possible answers, their Last play was 100% with 10 out 10 correct answers, which is also their Best play for this deck. Their First play was 80% with 8/10 correct answers.

Please note non-question cards are not counted in the Best, Last, and Average scores and Gems earned.
Plays
This meter shows both the number of sets played and the number of cards completed. Let take a look at the data below. From this comparison, we can see that student 1 has played the deck 2.5 times. Student 2 shows that the student completed the decks 2 times. Student 3 shows that they have played all the cards in the deck once.
In the case that a deck contains more cards than are served in a single batch, the "Plays" metric may not match the number of play sessions for a student. In the example below, the deck has a total of 25 cards, but the deck is only shows 20 cards at a time (20 cards per "Batch").

In this case, the student has 2 and a half play sessions, where they played 28 cards. However, halfway through the Third batch they saved their play and quit. Therefore, they have not completed 3 full Sets and the "Plays" metric shows 2.5 sets.
Key Terms: Batch & Custom Play Settings When students play a deck, they get a "Batch" of cards. For Flow Magic decks, the Batch size is all the cards in the deck. For non-Flow Magic decks, the Batch size is 20 cards unless the author has set a different default. For assigned or Hyperplay delivered decks, teachers can change the Batch size using "Custom Play Settings" for the deck.
How can you use this data? It can be used as a visual tool to know how many times the student has played the deck, and how much is left to play. This is very useful to know when it's time to export/print the data.
Gems
You can now view gems in the main report. This number represents the same thing as the "Blue Circle" on the student page. This represents the number of cards that have been answered correctly on the first try for each set. The goal is for the first number to match the second number. The students can re-play the deck to earn Gems on questions they may have missed.
Key Term: Set: a set is the total number of cards in a deck, regardless of how many cards are served per batch. Students may have to play a deck multiple time to complete a Set.
Time
Time shows the total amount of time spent on all cards.

How can you use this data? This metric can be used to determine mastery, fluency, level of difficulty, and much more. It can also be useful when assigning new decks, to either increase or decrease the difficulty of assignments.
Average (Avg)
The average is computed from every recent card play, using the 3 most recent sets. If any card was answered incorrectly, the Average cannot be 100%. The bottom number shows the number of correct cards out of the total number of cards answered.

How can you use this data? This metric can be used to see where students' knowledge is in relation to their peers. When you know what level the student is working at, you can decide to either increase or decrease workload, and/or change the level of difficulty. This is also useful for grouping students by proficiency level.
Best First and Last Scores
Best will show you both a percentage and the number of correct answers from the student's best Deck complete play through. First shows the same for the first played set. Last shows the same thing for the most recent set. The bottom number shows the total number of correct answers out of the number of cards in the deck.
Best compares the last three full play throughs and returns the best of the last three sets.

First is calculated from the first play set, not the first batch.

Last is calculated from the most recent playset, not the most recent batch.

How can you use this data? This metric is used to determine if the last play has been the best one if there has been an increase in mastery, if the student understands the material or if they have just memorized the cards. It can help you decide if you need to assign Boom Cards with the same skill, but with different material, so you can compare the results with the average, and/or for summative assessment.
Key Term: Sets A full set may be composed of multiple batches of a student play and often may include "partial batches".
Once a full set has been answered, the calculations for Last First and Best are based on the 3 most recent deck sets.
Additional Report Views
There are two other reports you can view:
- Individual Student Report
- Individual Reports from the teacher's view
- Deck Detail Report
Individual Student Reports (Student Report View)
Clicking on the student name will take you to the student page where you can view their most recent plays and currently assigned decks.

Bonus Tip: You can also access this page by choosing "Report" in the student drop-down from the classes page

The Student Report View Looks like this. This is also what the student sees when they log into Boom.
(Click Picture to Zoom)

Coins, Gems, and Pulses (Lightning Bolts)
These are rewards and achievements that students earn for playing Boom Cards. You can learn more here: Coins, Gems, and Pulses

Individual Student Reports (Teacher View)
You can view reports from an individual student from the main reports screen. Start by selecting the Classroom your desired student is in from the "Classrooms" panel.


Then, using the Search Bar, type the name of the student you want to view. This will remove all other students from your displayed list. If you have two students with the same name, you might need to change their nicknames within the classroom to include a middle or last initial.

Progress & Gems
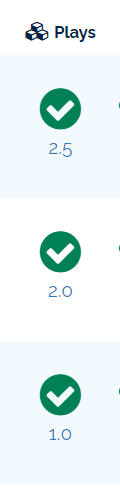
Progress (Green Circle) in Student Report View shows whether a student has completed all the cards in the assignment. For some assignments, students will play all the cards at once. For others, students may play them over a series of smaller sets of cards. The goal is to turn the green circle from light green to dark green. The number in the center of the circle represents the number of cards that the student has played within the deck, regardless of whether they answered it right or wrong. The checkmark signals that the student has played/answered all the cards, regardless if they answered correctly or incorrectly.

Gems (Blue Circle) shows whether a student has mastered the content in the Boom Cards deck. Unless an item was assigned as an assessment, the goal is to keep playing, until the student has mastered all the Gems in the Blue circle.

Deck Detail Report
Clicking on the progress, mastery, and/or plays circle from the "Reports" tab or the "Student View" will take you to a detailed report for that deck and student. It'll show you what the student answered on each card. These charts show data from the 3 most recent sets.
(Click Picture to Zoom)

If you see a purple speech bubble in your students' individual reports, that means you have a card to manually grade. To find more information about manually grading, visit
Performance by Play Session
The Performance by Play Session chart allows you to compare progress over time. Each bar shows accuracy data for that play session. Clicking any bar on the graph will change the "Accuracy" and "Fastest Correct Response" data to show data for that play session.
How can you use this data? This metric can be used to measure progress over time and to view data for a specific playthrough rather than the last 3 sets. You'll be able to spot trends and determine if your student is ready to move on to more difficult material.
Accuracy
The accuracy percentage is calculated from the most recent 3 sets. Clicking any red bar on this chart will show items answered incorrectly along with the correct answer. This is helpful for reviewing problem areas and identifying areas of improvement. You will also see a log of each time they have played this deck.
How can you use this data? This metric can be used to compare the results and/or determine the percentage increase in knowledge. If the student has a score 2/10 at first and then 10/10, then the student had an Accuracy increase of 80%… learning gain. It is like a pre-test and post-test in quantitative terms!
Response Time
This chart shows the fastest response for each card, regardless of the number of sets or batches that have been played. In this case, a taller bar represents a slower answer speed. You can click on any bar to view the card for that entry. The red line represents the average answer speed.
How can you use this data? This metric can be used to see which questions the student is answering quickly, and which they may be struggling with. You can use this to identify specific areas where re-teaching or a new approach may be needed.
Printing an Individual Student Report
From the Student Report View, you can print the page. The printout will show the scores & timestamps for recent plays for that student. you can also choose to print the student's answer choices for your records. From the Print settings, you can choose to print the cards 1 per row, 2 per row, or 3 per row.

You can Export/Print and analyze this data, and you’ll be set for the Progress Report Day!
How to Export Reports
You can print reports from either the Reports tab or the "Student View" of an individual student's reports. The Export button will create a downloadable CSV file (for Excel) with the data organized by the deck and student.
In either Reports view, select the classroom and decks that you would like to view data from. Then, click the Export button.

You will be prompted to choose a destination for the file on your device. Once you have saved the file, you can open it in Excel. The data will be formatted in a simple table layout with the student's name and deck name.

If needed, you can also manually copy and paste data from your Reports tab into a spreadsheet by following these steps:
- Select the Classroom you want a report for.
- Select all the decks that need to be in the report (you can see get reports for decks that are not currently assigned in Reports).
- Copy the data
- Format the columns of your sheet as "Text" (Not general or any other format)
- Paste and select "Match Destination Formatting"
If you have any further questions, please feel free to email us at help@boomlearning.com or call us at (833) WOW-BOOM. A real human will happily help you!